When an LLM Says 90%, Should You Believe It?
Measuring LLM calibration by asking 102 factual questions and checking if stated confidence matches actual accuracy. The answer: models are overconfident.
One of Trust Bench’s core evaluation dimensions is calibration: does a model know when it doesn’t know? If a model says “I’m 90% confident” and it’s right 90% of the time, you can build reliable systems on top of that signal. If it says 90% and it’s right 70% of the time, every downstream decision that trusts that confidence score is compromised.
I needed to measure this before building Trust Bench’s calibration module. So I built calibration-probe to see how bad the problem actually is.
The setup
102 factual questions across five categories: geography, science, history, math, and common knowledge. The model is forced to answer each question AND state a numeric confidence from 0 to 100. Then I check: when the model says 90%, is it actually right 90% of the time?
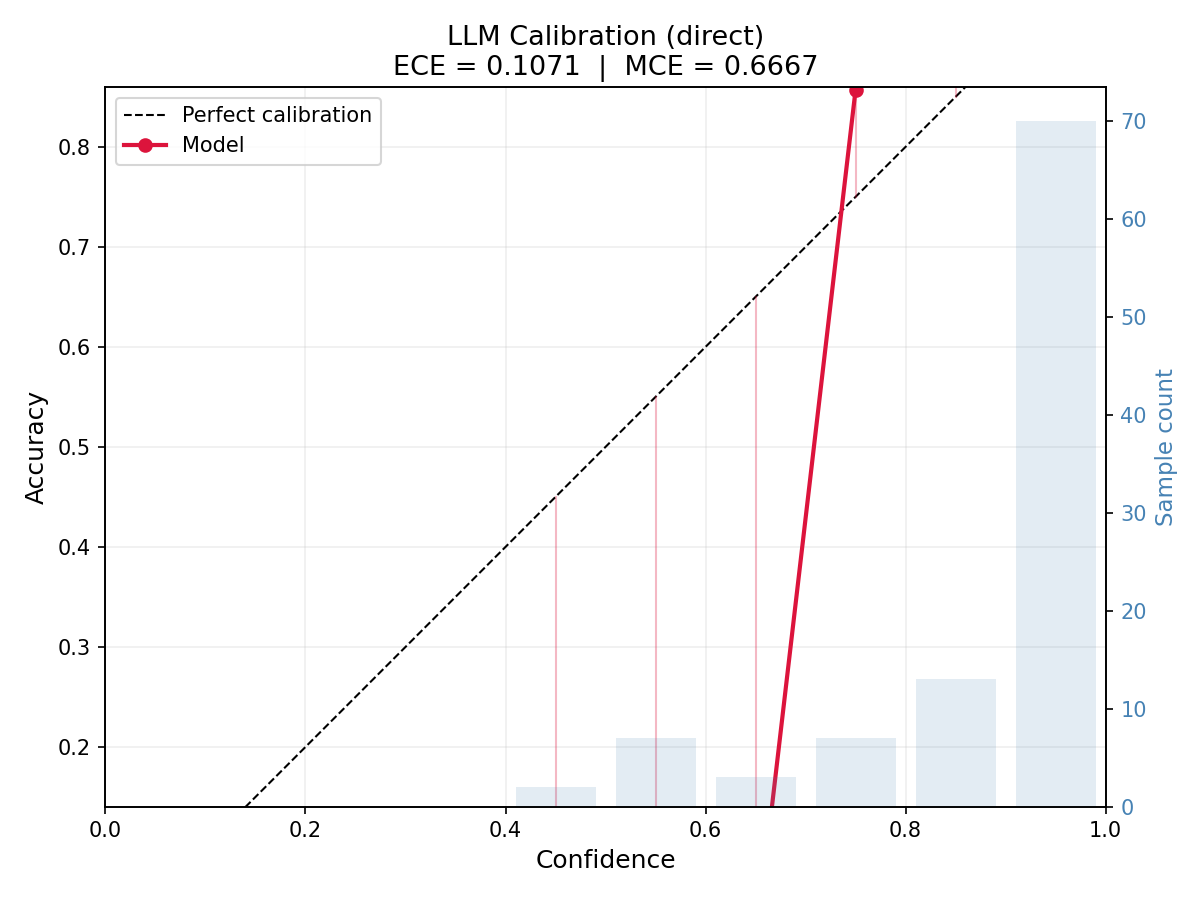
Perfect calibration means the confidence-accuracy curve is a straight diagonal. Every stated confidence level matches its observed accuracy. The gap between the diagonal and reality is the calibration error.
What the numbers show
- Mean stated confidence: 89%. The model is quite sure of itself.
- Actual accuracy: 86%. Not bad in isolation, but the gap matters.
- ECE (Expected Calibration Error): 0.107.
ECE compresses the full calibration curve into a single number. It’s the weighted average of the gap between confidence and accuracy across all bins. An ECE of 0.107 means the model’s confidence is off by about 11 percentage points on average.
For context: well-calibrated models in the literature achieve ECE below 0.05. Modern LLMs typically land between 0.08 and 0.15 depending on the domain and prompting strategy. 0.107 is worse than median but not catastrophic. The problem isn’t the average. It’s where the error concentrates.
In the 90-100% confidence bin, the model is right around 88% of the time. It reports near-certainty for answers that are wrong roughly one in eight times. For a medical system or a cascading architecture that trusts high-confidence answers, that gap is the difference between a reliable system and a dangerous one.
Category breakdown
Geography is the worst. The model reports high confidence on capitals but gets tripped up on the tricky ones: capitals that are not the largest city. It said “Sydney” for Australia (confidence: 72, wrong), “Lagos” for Nigeria (confidence: 58, wrong), “Istanbul” for Turkey (confidence: 60, wrong), “Dar es Salaam” for Tanzania (confidence: 55, wrong). The pattern is consistent: when the well-known city is not the capital, the model guesses the well-known city and hedges slightly, but not enough.
Math has the best calibration. High confidence, high accuracy. 19 out of 20 correct, with confidence levels that track difficulty. The one miss was a Fibonacci indexing question where it reported 65%, a reasonable hedge.
Science and history fall in between. Textbook facts are solid. Edge cases trip it up. “Silicon” for the most abundant element in Earth’s crust (it’s oxygen by mass). Gutenberg press placed in 1450 instead of 1440. Both stated with moderate confidence.
Common knowledge had two interesting misses: China’s time zones (the model guessed 5, the answer is 1) and Scotland’s national animal (guessed lion, it’s a unicorn). Both had lower confidence, 45% and 55%. The model at least partially knew it was uncertain.
What surprised me
The geography pattern is the most revealing. The model isn’t randomly wrong. It’s systematically wrong in a specific way: it substitutes the most salient city for the actual capital. This is a frequency bias, not a knowledge gap. The training data mentions “Sydney, Australia” far more often than “Canberra, Australia.” The model has seen the correct answer. It just can’t override the stronger association.
This is exactly the kind of failure mode Trust Bench needs to detect. Not “the model doesn’t know,” but “the model knows the wrong thing more confidently than the right thing.” Output-level evaluation catches this as a wrong answer. Trust Bench should be able to detect the competing activations that produce it.
Prompting strategy changes calibration
calibration-probe supports multiple prompting strategies: direct questioning, chain-of-thought, and explicit step-by-step reasoning. Chain-of-thought tends to improve calibration, not by making the model more accurate, but by making it better at recognizing when it is uncertain. Forcing the model to reason before committing to an answer gives the internal uncertainty signal more room to surface.
This is relevant for Trust Bench’s improvement stage. If prompting strategy alone can shift calibration, that’s one of the targeted techniques Trust Bench should test and measure.
How this connects
Calibration is one of TrustLLM’s six evaluation dimensions. Trust Bench’s extraction stage needs to pull confidence signals from model internals, not just from stated confidence in the output. The question is whether internal signals (logprob entropy, attention pattern consistency, layer activation variance) are better calibrated than the model’s self-reported confidence. If they are, Trust Bench can build a better uncertainty estimate than the model gives you itself.
This probe gave me the baseline. The next step is comparing external calibration (what the model says) against internal calibration (what the activations show).
Try it
git clone https://github.com/amaljithkuttamath/calibration-probe.git
cd calibration-probe
pip install -r requirements.txt

# With an API key
python probe.py

# Without (uses sample data)
python probe.py --dry-run
The dry run generates a reliability diagram from the included sample data. The code is MIT licensed.